Geospatial Measurement Solutions, LLC: Custom software development; database maintenance and development; remote sensing analysis, data collection, mobile technology implementation, and scientific analysis and documentation.
Wildland-Urban Interface (WUI) and Wildland Fire Data Collection (National Institute of Standards and Technology Fire Research Grant 60NANB11D173)
Examining National United States WUI and Wildland FIRE Data
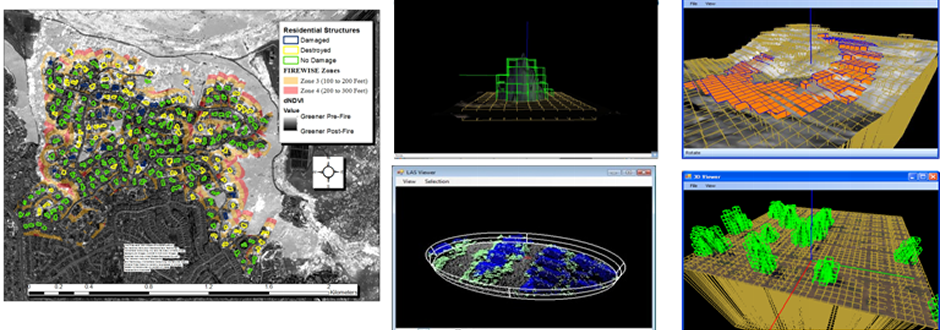
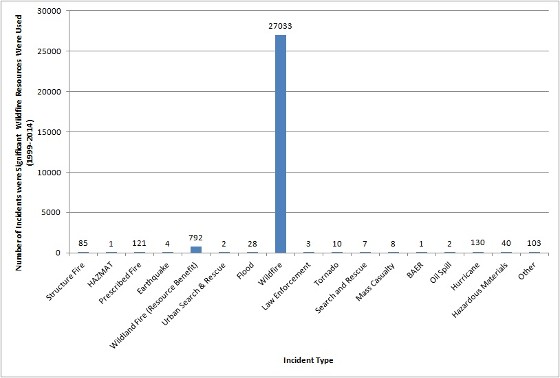
Definitions provided in the US Federal Register can be interpreted in different manners with alternative definitions allowed based on population density. In fact, it has been suggested that mapping of WUI areas might vary based on purpose and context (Stewart, et al., 2007). Examples of three WUI community types defined by the US federal register can be seen in Web Map 1 shown below. Open the web map in full screen and expand the side bar to view other examples of the three WUI Community types. Understanding the spatiotemporal nature of wildland and WUI fire events is important to making progress towards alleviating loss of life and property resulting from these events. Spatiotemporal representations of wildland fire destruction do exist at various scales. The Fire Program Analysis (FPA) Fire Occurrence Database (FOD) represents an example of a significant spatiotemporal database of wildfires across the US. The location of the respective wildland fire is denoted by a single point in general proximity to the fire with an associated date and other information. Statewide data sets covering significant temporal periods also exist in California through the Fire and Resource Assessment Program (FRAP). Other estimates of mapping burning severity exist for some fires through the Burned Area Emergency Response (BAER) Program and the Monitoring Trends in Burn Severity Program. Fire perimeters and other spatiotemporal information from significant incidents are also available through the United States Geological Survey (USGS). In response to the need for an integrated approach to managing wildland fire occurrence data the Integrated Reporting of Wildland-Fire Information (IRWIN) Program was developed. Web Map 1: Various WUI Community Types (View Map in Full Screen) There is, however, less information on the spatiotemporal extent of WUI damage and destruction at fine scales across the US. The Conservation Biology Institute (CBI) and the USGS have mapped WUI damage and destruction to structures across San Diego County and the Santa Monica Mountains at the structure level between 2000 and 2009. Some state estimates of WUI destruction to the built environment also exist (e.g. California) at relatively significant temporal scales but coarse spatial scales. The National Fire Incident Reporting System (NFIRS) provides a mechanism to capture destruction from vegetative fires of various categories but is not used pervasively across the country and is onerous to record damage and destruction for fires destroying large numbers of structures. Other representations at the national level exist from the Insurance Service Organization and various federal agencies keep records on WUI damage and destruction such as the United States Forest Service (USFS) FIRESTAT database. The core of understanding of damage and destruction to the built environment from WUI fires in the US comes from the SIT-209 database containing information recorded in the ICS-209 form.
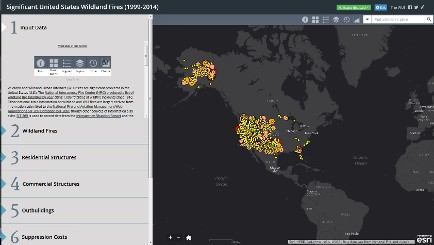
This information is important to understand when and where significant outbreaks of WUI and wildland fires might occur and can aid in resource allocation, targeted community messages at appropriate times and other mitigation efforts. For example, web map 2 shown below portrays US drought monitor index data overlaid with SIT-209 fires portraying a correlation between significant wildland fire and drought. Figure 4 portrays an image of an interactive web mapping application examining wildland fire and WUI structure destruction by wildfires between 1999 and 2014 from the SIT-209 database. The coarse scale information portrayed in the maps below do not, however, provide finer scale information (e.g. parcel or structure level damage and destruction) to understand basic information such as the amount of destruction occurring in various WUI community types and building features that are damaged (i.e., structure vulnerabilities). Even finer scale information portraying damage to structural elements is essential to better understand the fire problem as highlighted in Maranghides and McNamara (2016).
Source: https://fam.nwcg.gov/fam-web/ Web Map 2: Spatiotemporal extent of WUI primary structure destruction across the United States.
Other significant efforts at mapping the WUI across the United States have occurred such as the portrayal of WUI community types across the United States. As can be seen in the map below, WUI communities exist in the eastern US in areas where there has not in recent history been significant destruction to the built environment from wildland fire, comparatively to the western US. Montioring the spatiotemporal extent of WUI damage and destruction might aid in identifying conditions that produce destructive WUI fires. This monitoring might aid in identifying when conditions might occur that could produce large destructive WUI fires. For example, climate change could result in conditions in the eastern US, where WUI areas are extensive but have historically not seen significant destruction from a single large wildland fire, that produce large destructive fires. Figure 6: 2010 Wildland-Urban Interface overlaid on primary structures destroyed by wildfire between 1999 and 2014 (SIT-209) and NFIRS WUI recorded exposures. Nonetheless, detailing the spatiotemporal aspects of WUI and wildland fires at fine scales (e.g. structure or parcel level) is a difficult undertaking. The result is a lack of information regarding the geographic nature, physics, sociological aspects and other factors related to WUI and wildland fire except at coarse scales or limited cases. Furthermore, detailed WUI and wildland post-fire information (e.g. fire time lines, defensive actions, burned vegetation, etc...) is limited, in part due to difficulties in acquiring this data. Consequently, WUI and wildland mitigation advice must currently be based on expert opinion of first responders present at various incidents rather than actual conditions as measured and assessed in during-fire and post-fire environments over some appropriate geographic area and time period. A better understanding of exposure conditions (i.e., flames, radiant heat and embers produced by a fire) received by structures during WUI fire events and produced by wildland fires might lead to development of representative laboratory test methods for identification of appropriate WUI landscaping and building codes and standards. | ||||||||||||||||||
©2013 Geospatial Measurement Solutions, LLC - 2149 Cascade Ave. Ste. 106A PMB 240 Hood River, OR 97031, USA 541-436-4486 dmgeo@gmsgis.com